Assessing Learning Outcomes at Grinnell College
The following project was completed for CSC 324: Software Design and Development at Grinnell College. This project was completed as part of a team; my specific contributions are highlighted.
Introduction
The Center for Teaching, Learning, and Assessment (CTLA) at Grinnell College partners with academic departments to facilitate an annual assessment process. This process involves the collection and review of key documents including mission statements, learning outcomes, curriculum maps, evidence of student learning, and assessment reports.
The purpose of this project is to streamline and enhance the CTLA’s assessment workflow by:
- Creating a user-friendly Qualtrics form for departments to submit their annual assessment materials
- Developing a Shiny web application with interactive visualizations that allow the CTLA to: a. Track each department’s progress through the assessment steps b. Explore the relationships between courses, program learning outcomes (PLOs), and college-wide learning outcomes (CWLOs) c. Access and review individual department submissions
By providing intuitive tools for data collection and analysis, this project aims to increase the efficiency and impact of the CTLA’s assessment efforts, ultimately supporting the continuous improvement of student learning at Grinnell.
In my role, I led project architecture and organization, developed a pipeline for users to input curriculum mapping data, and created two network plots for visualizing inputted curriculum mapping data.
Project Architecture
The system utilizes a monolithic architecture, defined by its use of a single deployable unit featuring all components of the codebase [1]. The alternative would be a distributed architecture (having multiple services running independently), but the use of Shiny lends itself more to the monolithic approach which was satisfactory for this project. Specifically, the application employs a layered architectural pattern, a specific category of monolithic design in which a system is comprised of horizontal layers that serve specific roles in the context of the system as a whole. The layered architectural pattern is a natural choice for many applications due to its simple and intuitive structure [2].
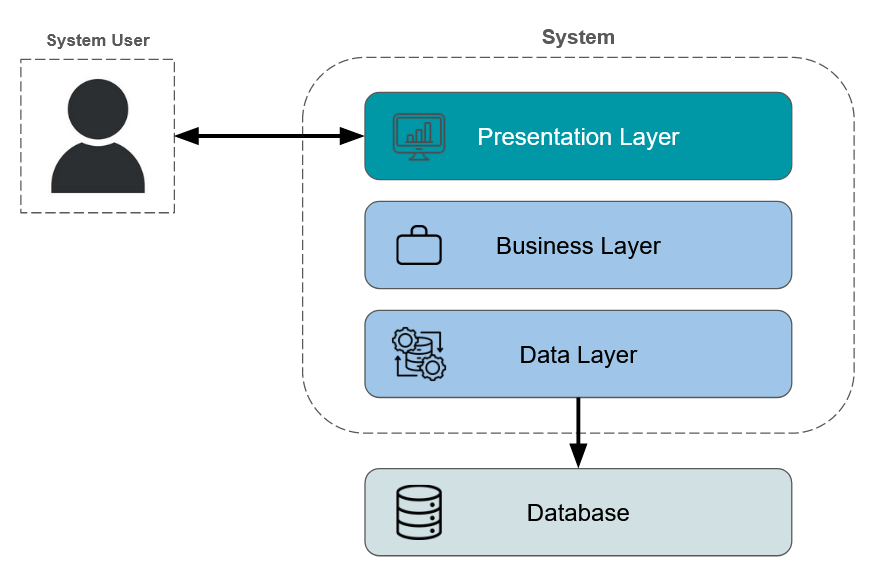
As seen above, our system follows a 3-tier architecture characterized by a presentation layer, application layer, and data layer that depends on a database [3]. An explanation of each component follows:
- Database: Consists of files in the
data/directory, including Excel files filled out by department heads regarding curriculum mapping (found indata/Curriculum Mapping/) and data from Qualtrics form. - Data Layer: Comprised of data retrieval, cleaning, and basic handling, which occurs in the helper files found in the
helperCode/directory. - Business Layer: Contains the core business logic, i.e. processing the data from the data layer and applying business rules (like user-defined inputs or any required transformations) before the data can be used in the presentation layer.
- Presentation Layer: Defined in
ui.R, the user interface is built using Shiny’s reactive programming model. Key components include the sidebar for inputs, the main tabbed views for each visualization, navigation bar, and various output elements (tables, plots, etc). - System User: The system user interacts directly with the presentation layer through their direct manipulation of inputs and chart elements (hovering over plot objects, sorting tables, etc). The presentation layer is also the part of the application that is visible to the user (the front end).
The functionality of the system can be understood through a use case diagram in unified modeling language (UML) [4].
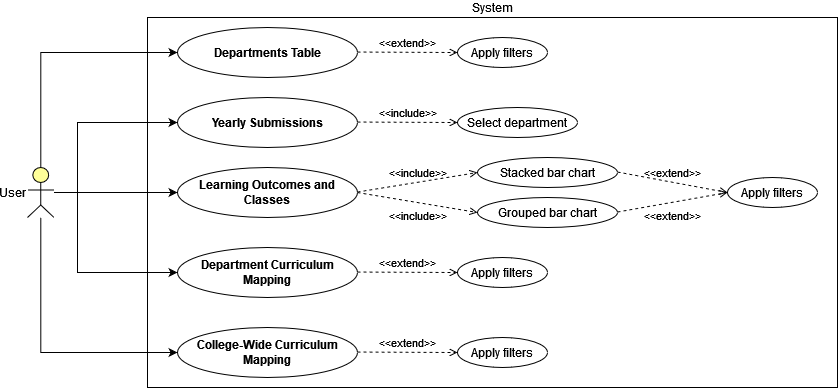
The user is able to directly interact with each of the five parent use cases.
- Departments Table: Trivially includes a departments table. Direct association with user represents the user’s ability to directly interact and influence what is shown in the table. Extends relationship with Apply filters, as filtering is optional and content will be shown regardless.
- Yearly Submissions: Trivially includes yearly submissions information. Direct association with user represents the user’s ability to directly interact and influence the content shown in the table. Includes relationship with Select department because selecting a department is required; by default, none is shown thus there is no content to present.
- Learning Outcome and Classes: Includes two visualizations within their own respective tabs; Stacked bar chart and Grouped bar chart. Direct association with user represents the user’s ability to directly interact and influence the content shown in the charts. Both visualizations are subject to the same optional filters, so each extends relationship with Apply filters.
- Department Curriculum Mapping: Trivially includes department curriculum mapping visualization. Direct association with user represents the user’s ability to directly interact and influence the content shown in the visualization. Extends relationship with Apply filters, as filtering is optional and content will be shown regardless.
- College-Wide Curriculum Mapping: Trivially includes college-wide curriculum mapping visualization. Direct association with user represents the user’s ability to directly interact and influence the content shown in the visualization. Extends relationship with Apply filters, as filtering is optional and content will be shown regardless.
Note that while not included in the use case diagram, all visualizations retrieve data from the underlying database which is influenced by the other actors involved (CTLA, department heads).
File Organization
Our development process raised a few potential problems that needed to be considered. For one, our system’s monolithic architecture (described above) inherently lacks in modularity and scalability [2]. Secondly, the fact that we have five team members who needed to work on the same application could have made the development progress a struggle due to concern over messing with someone else’s code. Our solution was two-fold: (a) we used a GitHub repository to allow for version control and the synchronization of changes, and (b) we organized our GitHub repository in such a way as to maximize modularity and scalability.
Our application’s directory tree is as follows:
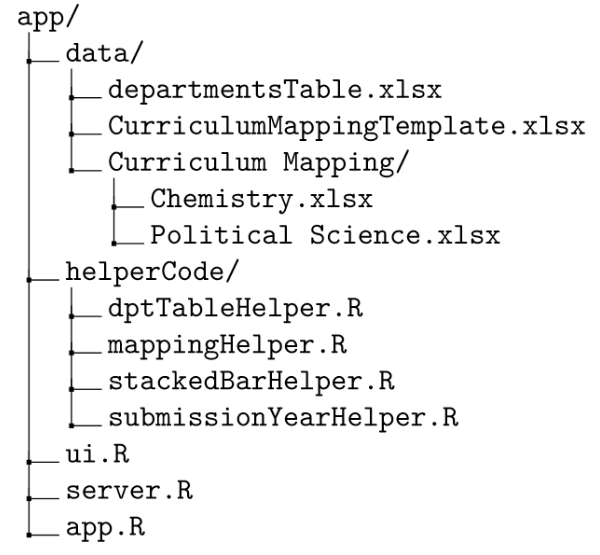
Shiny applications consist of a user interface object and server function, which predominantly handle the front end and back end respectively [5]. As is common, we chose to split the these components into the ui.R and server.R files respectively. The more unique strategy we employed was to split all helper code pertaining to our individual visualizations to their own files within the helperCode/ directory. The app.R file then runs the Shiny app itself after running all four helper files along with the ui.R and server.R files.
We could achieve the exact same product by putting all of our R code in one large file rather than splitting it into seven individual files. However, our file organization importantly makes our code modularized. If a future developer or stakeholder wishes to retrieve or modify code pertaining to a specific part of the system, like the data processing for the departments table, they can simply go into dptTableHelper.R rather than sifting through a much larger file. This also makes development easier because they will not have to worry about any other code in the process: everything is logically separated.
Additionally, the data/ directory includes a directory Curriculum Mapping/ which contains Excel files specifying an individual department’s curriculum mapping. For example, data/Curriculum Mapping/Chemistry.xlsx contains information regarding the Chemistry department’s curriculum mapping. Such a structure allows an unrestricted number of departments to be added as new files without needing to change anything with the code, thus exhibiting the system’s scalability.
Curriculum Mapping
Excel files in the data/Curriculum Mapping directory was designed to allow for intuitive and convenient user input along with seamless system integration.
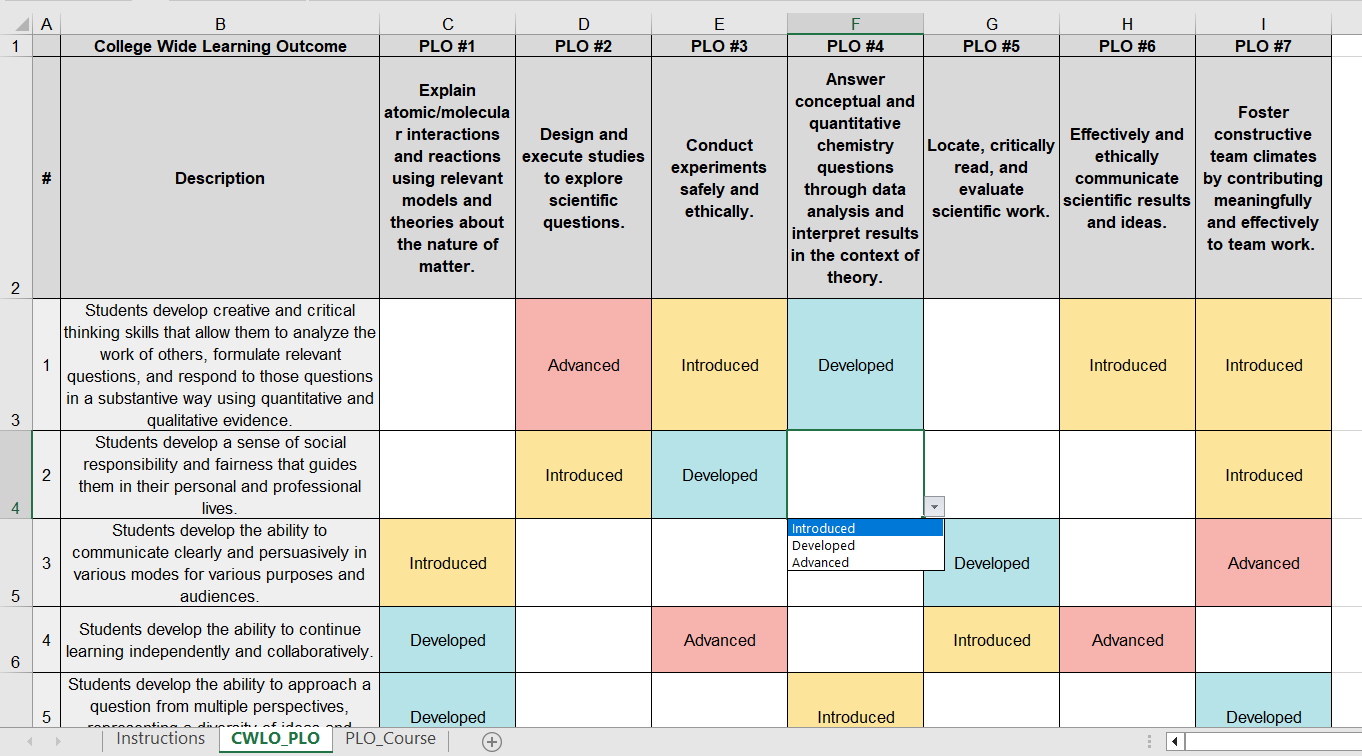
In the image above, we see that users are able to record any connections between college-wide learning outcomes (CWLOs) and program learning outcomes (PLOs) along with the level assessed of each connection (Introduced, Developed, or Advanced). The same can be done for course <-> PLO connections.
Once filled out to their satisfaction, the completed Excel file can simply be placed into the data/Curriculum Mapping directory and the product will process the data accordingly for the following two visualizations.
First, individual department curriculum mapping:
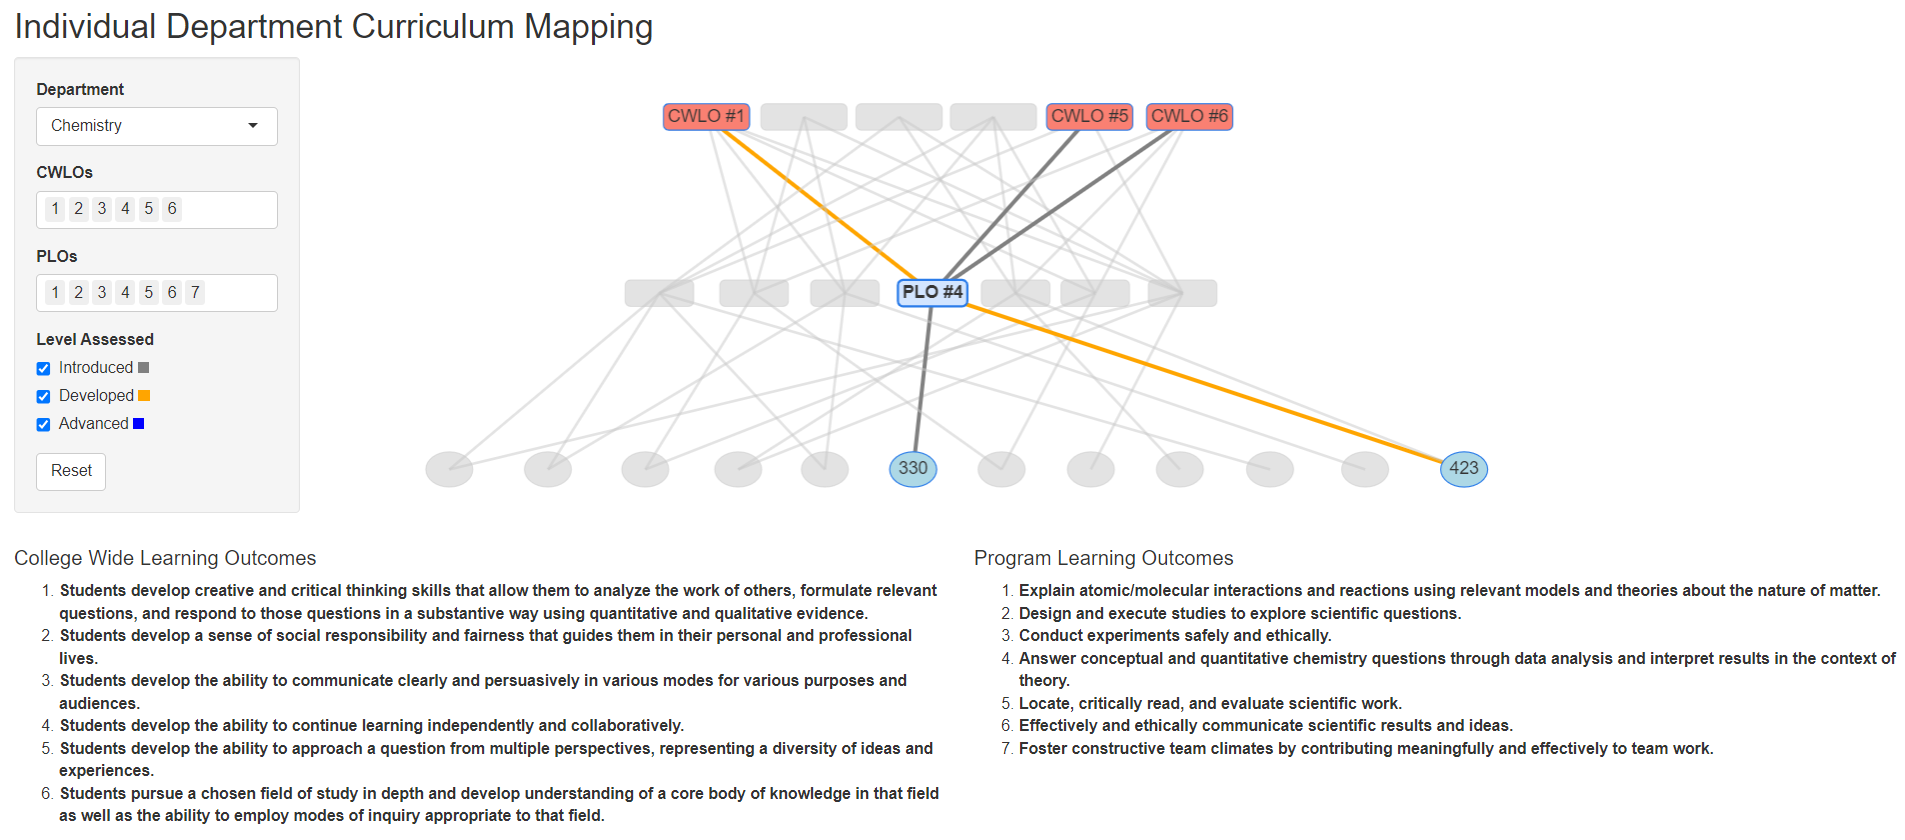
This tab of the Shiny app features a three level network showing college-wide learning outcomes, program learning outcomes, courses, and the connections between them for any department. Connecting lines are colored based on the level assessed for each connection. Each CWLO and PLO is written out below the visualization (with learning outcomes bolded if they are currently visible in the network). Various filters are present for CWLO, PLO, level assessed, and department. Users can hover over a node for a description (the written out learning outcome or the course title) or click nodes to only see adjacdent connections & nodes. The image above shows what it looks like if a node (PLO #4) is clicked.
And next, college-wide curriculum mapping:
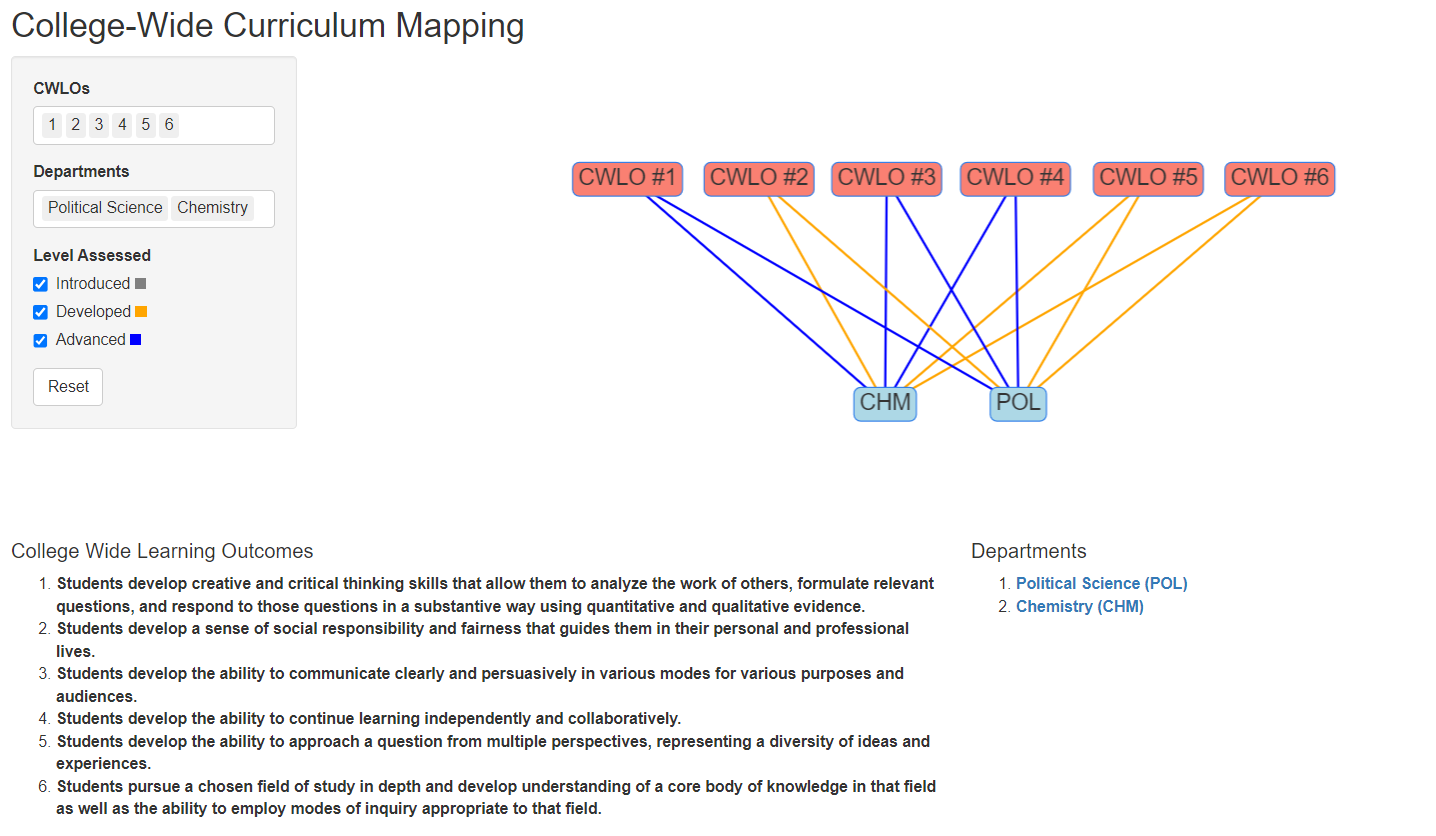
The idea behind this visualization is that a user may simply want to get an idea of which college-wide learning outcomes are being comprehensively addressed by different departments. If they want to look into a specific department, the hyperlinked departments in the bottom right link directly to the previous visualization with the corresponding department filtered to. The same filters as before apply along with functionality such as node hover and click interactivity.
References
- M. Richards and N. Ford, “Component-Based Thinking,” in Fundamentals of Software Architecture: An Engineering Approach. Cambridge: O’Reilly, 2020, pp. 99-116.
- M. Richards and N. Ford, “Layered Architecture Style,” in Fundamentals of Software Architecture: An Engineering Approach. Cambridge: O’Reilly, 2020, pp. 133-141.
- William. “Web Application Architecture: The Latest Guide 2024.” ClickIT Smart Technologies. Accessed: May 8, 2024. [Online]. Available: https://www.clickittech.com/devops/web-application-architecture/.
- S. Sundaramoorthy, “Introduction to UML Diagrams and Its Components,” in UML Diagramming: A Case Study Approach. United States: Auerbach Publications, 2022, pp. 1-22.
- “Basics.” Shiny. Accessed: May 8, 2024. [Online]. Available: https://shiny.posit.co/r/articles/start/basics/.